SQL Visualizer
What is SQL Visualizer and how can it help?
A SQL visualizer, also known as a database visualization tool or SQL query visualizer, is a software application designed to help users interact with and visualize data stored in relational databases using SQL (Structured Query Language). These tools typically provide a graphical user interface (GUI) that allows users to write SQL queries, execute them against a database, and visualize the results in a more user-friendly manner.

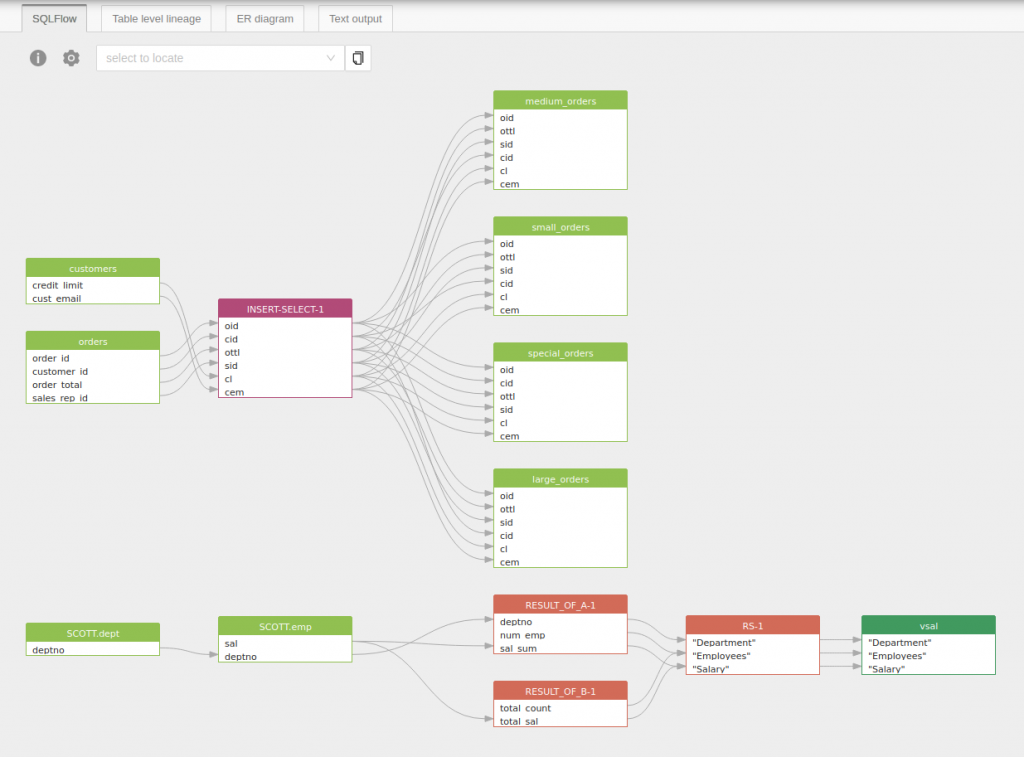
SQL visualizers that support visualizing data lineages aim to represent how data flows from its source to its destination within a database system. This is especially useful for understanding dependencies and relationships between tables and columns.
Data migration and ETL with SQL Visualizer
Data migration and ETL (Extract, Transform, Load) processes are critical components of managing and optimizing data within a system. SQL code visualizers can display the structure of both source and target databases or data sources. This helps developers understand the mapping between source and target entities, making it easier to plan and execute the migration or ETL processes. More importantly, during the transformation phase of ETL, developers often apply various data manipulation and cleansing operations. SQL code visualizers can represent the transformation logic graphically, making it easier to validate and troubleshoot the applied transformations.
Metadata about tables and columns, such as data types, constraints, and primary/foreign key relationships, may be displayed alongside the visual representation. Users may have options to filter the visualization based on specific criteria, such as time range, data type, or specific columns. This can help narrow down the focus and simplify the representation for large and complex databases.

Using SQL visualizer to generate ER diagram
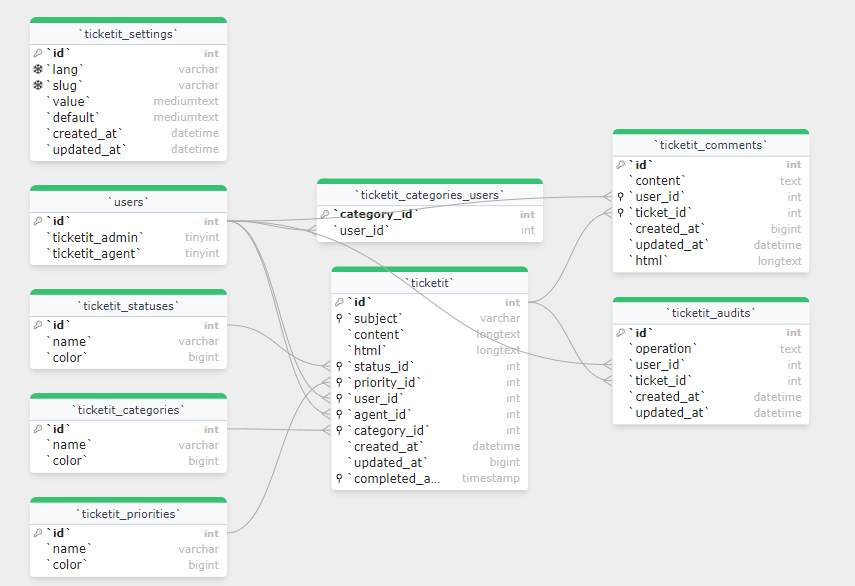
SQL visualizers often provide features for generating Entity-Relationship (E-R) diagrams to help users visualize and understand the structure of a database. The process of generating an E-R diagram typically involves analyzing the underlying database schema and representing entities, attributes, and relationships graphically.

Visualize Join
A SQL code visualizer assists users in understanding and visualizing the structure and flow of SQL queries, including the join conditions. The visualization of join conditions helps users comprehend how tables are related in a query. The SQL visualizer first parses the SQL code to identify the different components, including tables involved in the query and the associated join conditions. It identifies the tables used in the query and locates keywords that indicate join operations, such as INNER JOIN, LEFT JOIN, RIGHT JOIN, or FULL JOIN.
Taking the following SQL as example:
SELECT o.order_id oid, o.customer_id cid, o.order_total ottl,
o.sales_rep_id sid, c.credit_limit cl, c.cust_email cem
FROM orders o, customers c
WHERE o.customer_id = c.customer_id;
The SQL code visualizer should generate the data lineage similar to the following picture:

Summary
Keep in mind that the specific features and capabilities of data lineage visualization can vary between different SQL visualizer tools. Examples of SQL visualizers that may support data lineage visualization include tools like Gudu SQLFlow, Tableau, and Talend, among others. Users should refer to the documentation of their chosen SQL visualizer for detailed information on how to utilize data lineage visualization features.
All the pictures in this blog are generated by Gudu SQLFlow online sql code visualizer: https://sqlflow.gudusoft.com

